
Website Analytics: The metrics we rely on to make a difference to performance
This article looks at the handful of metrics you need, and clever ways to improve your data analysis and insight.
There was a trend, in what now seems like a lifetime ago, to have a panic about BIG DATA and how to crunch through the vast quantity of marketing information we could get our hands on. Over time, we’ve absorbed a lot of it, but insight is still hard to glean, even in the age of AI-driven number-crunching.
As a department, we have access to more platforms and more data than we’ve ever had. We have our SEO platforms, our website analytics, our social media management and results, our emails, our Substack, and on and on.
They often don’t connect with each other, and dashboard platforms such as Data Studio are hard to construct and even harder to check that they’re working efficiently and the data has integrity.
Website Analytics in Brief for the Skim Readers
Look for just a few GA4 metrics regularly rather than diving into deep data every time.
Focus on Users, Engaged Sessions, Engagement Time Per User and Key Events (conversions). If you can get a good handle on these four, then a lot of the data will start to make sense.
Jumping between platforms costs you time and accuracy
Finding the individual reports from your SEO platform, Social platforms, Email platform, etc. Costs your team an incredible amount of time they could spend actioning insight. Consider specialist data platforms such as PolyBox, with account management support to create the all-in-one reports you need to generate regular insight quickly.
Your teams need training to learn what good insight looks like
With so much data, your teams need help gaining the confidence required to quickly isolate data that can provide insight and increase performance. Work with marketing training specialists (like us!) to improve SEO, GA4, Google Search Console, and LinkedIn skills.
GA4 Training and Website Conversions
We can help improve your website performance or your team's skills
Marketing metrics you can actually use
With such an overwhelming number of options in Google Analytics or any marketing data platform, knowing which metrics matter and how you can use them to improve your marketing performance is essential. We’ll look at a few now across different platform types and how they can be used to influence your strategy and enhance lead generation.
Active Users & Returning Users in GA4
There are several different ways you can measure users landing on your website. Each one has a different calculation in GA4 behind it, and knowing which are important is crucial if you want to track the right website visitors.
Active Users is your best data point for the number of users landing on your site. You could choose Total Users – but this is often miscalculated, and you find your new users are higher than your total users! This makes it unreliable. Users/New Users are the people finding your site for the first time, which means you’re missing the total number on site. So for all users on site at any one time, rely on Active Users.
Returning Users is not actually a true measured metric in GA4; it’s a calculation based on the attribution for the IP address when a visitor returns. This means the data is hard to pull into separate platforms such as Data Studio accurately. It is, however, essential to measure and monitor as the majority of customers will only convert after two or more visits to your site. So the higher the retention rate, the more likely you are to generate leads.
Engaged Sessions and Engagement Time Per User
In Universal Analytics, everything was measured as a session, but with the upgrade to GA4, events are the key drivers of actions in your data. A session can therefore be triggered by any action, however small, taken by a user on your website. What we should be measuring is the number of engaged sessions. An engaged session is any user who has stayed on your website for 10 seconds or more, or triggered two events on the website. This filters out much of the spammy data that sessions picks up and gives a truer picture of traffic on your site. Use engaged sessions alongside user data to help build your data on user acquisition, particularly across pages and landing pages.
Key Events – essential for measuring lead generation
Conversion, Goals, Leads, Sales- these are all now known as Key Events in GA4. Google have made it very easy now to set up key events, and this is the best way you can find out how your website is performing for lead generation or sales.
Where you view your key events influences the type of insight you can gain on your website and customer journey:
Acquisition Reports
If you view the User Acquisition or All Traffic report on GA4, then you are seeing which traffic channel is performing best for conversions. A low key event score against high traffic on organic search suggests that your SEO is working, but your website isn’t providing the right customer journey to drive conversions, or you’re attracting the wrong type of persona to the website. Knowing which channels are performing and which ones need help is superb insight for your content marketing strategy.
Pages and Screens and Landing Pages
These reports show key events in two distinct ways. Pages and Screens show the key events as they happened on the page, which is why the Contact Us page will always top the key events reports. You can measure the effectiveness of each page as a conversion tool. If your main landing page has a form that’s too clunky, then you might see lots of traffic but low key events, which gives you a priority on where to start to improve lead gen.
Landing Pages is slightly different. Here, key events are attributed to the first page the customer lands on in their website journey. For instance, you might have a top-ranking blog that then drives customers deeper into the website. Each time they convert and trigger a key event, that conversion is attributed to the blog page they started on. This is a great report for showing which of your landing pages are attracting the right traffic and launching users into the best customer journeys.

Average Website Ranking
Your Average Website Ranking tells you how well your website is doing across all keywords it ranks for on search engines. This is not measured in GA4, but either in Google Search Console or an SEO platform such as SE Ranking.
Alongside diving into individual keyword performance, your average ranking gives you a snapshot of improvement or decline. The closer to 100 your website is, the harder you need to push to improve your overall SEO strategy. This might be through content creation, website improvements or SEO training for your marketing teams.
Click Through Rates
Whether you are investing lots of time and resources in LinkedIn, your email campaigns are driving awareness, or your PPC campaigns are costing a fortune, your click-through rates will quickly tell you if your targeting and content are aligned and working.
Click-through rates are a key indicator for:
1. Whether your campaigns are optimised, to the right segment with the right message
2. Whether you are pushing your social too hard or need more resources
3. Whether your PPC campaigns are targeting the right keywords with the sales pitch
If your click-through rates are high, but your conversions are low, then you have a website experience issue. If your conversions are high but your CTR is low, then it’s a targeting and content issue in your channel marketing. Knowing where your CTRs sit should greatly influence your strategy and performance.
Learn more about our digital marketing training
We can help upskill your team so they see insights not data
The cost of combining your data points
Finding all these metrics and combining them has traditionally been very cumbersome, unreliable and time-consuming. Teams need to know their platforms inside out and then have the time and inclination to pull reports from each one to combine them into something useable in stakeholder communications and line reporting.
Google’s Data Studio (formerly Looker Studio) is the tool most commonly used by marketing teams to join data points together to create holistic dashboards that can then be sent to senior managers, execs and invested stakeholders or clients. But, as with most Google products, it’s slow, very hard to pick up and not supported by simple, plain-speaking help.
A superb alternative is available, however, so don’t panic!

PolyBox Dashboarding and Analytics
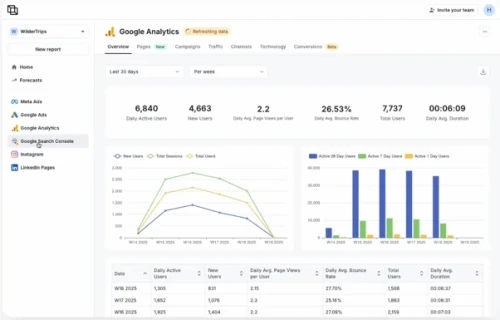
Recently, we’ve started migrating our analytics across from Data Studio into PolyBox. This is an all-in-one dashboarding tool, supported by excellent account management support. The joy of PolyBox is that time-saving and accuracy are improved greatly, and all marketing platforms can be sliced, spliced and diced in whatever way we need to show insight in the clearest way possible.
It’s very easy to use, and very easy to connect – much more so than Data Studio. This means marketing teams are more likely to engage with it and drive marketing awareness rather than react to report requests.
Insight is more visible, and the AI commentary helps to highlight key points where the data might seem more abstract.
We strongly recommend trialling PolyBox if you are using Power BI or Data Studio; it was designed specifically for marketers and the difference is astounding.
Driving insight from website analytics through training
The other barriers to improving performance through website analytics are team skill levels. If teams don’t understand the data they’re looking at, or don’t know what impact might come from ignoring key indicators, then marketing and lead generation performance will suffer.
Arboreal Marketing provides bespoke training for:
- Google Analytics, Google Search Console and Data Studio
- SEO and Google Analytics
- LinkedIn for B2B Sales and Marketing Teams
- Email Training for Sales and Marketing teams
Each training session is fully tailored to your organisation and skills gaps, is cost-effectively priced per session rather than per person and has an excellent reputation for delivering practical skills your team will use straight away.
Avoid analysis paralysis and book a website audit
Arboreal Marketing can audit your website and help you improve conversion performance
Bringing everything together to improve marketing performance through website analytics
To improve marketing lead generation and performance, you need strong analytical skills in the team, an understanding of the data at your fingertips and quick and reliable data visualisation.
Monitoring and actioning the key performance indicators above, alongside dedicated training from Arboreal Marketing and PolyBox as your dashboarding tool, will mean you have all of the above, ready to enhance sales and performance further, while delivering a return on investment to your organisation.
Website Analytics: Frequently Asked Questions
Checking data daily is time-consuming and won’t show trends clearly. You will often get stuck in the weeds. Depending on the type of data or the purpose of use, tailor your monitoring so that:
- Campaigns are monitored weekly or bi-weekly so they can be changed if results don’t go as planned
- Rankings and SEO are monitored monthly; daily fluctuations can cause unnecessary panic, but changes over a month are a trend to be actioned.
- Email data is measured daily – you have a small window of around 48 hours before emails become stale
- Social Media engagement is measured monthly – on an average of 1 post per week, a monthly report will suffice.
No, PolyBox connects with your data and integrates it into one place. They can connect to over 700 different platforms and bring them into dashboards that are easy to manage and share across the business. It’s a fantastic visualisation tool for marketing performance.
Yes, but they aren’t as important as Engagement Time per User. A session with no actions, under 10 seconds, counts as a bounce. This can lead to mistaken decision-making, as it doesn’t reflect the page performance and doesn’t account for bot usage on a website. Engagement time per user provides a solid reflection of how well the content and page design are working for users.
Yes, if a user rejects cookies, then you won’t be able to track their customer journey through your marketing channels. Platforms such as GA4 have an “attribution model” built into their data gathering so it can make an assumption of where users go, without needing cookies.
In Google Analytics 4, a USER is a website visitor (a person), while a SESSION is a visit by a user. Therefore, you can have multiple sessions per user if your website retention rate is high.
Need help training your team?
Arboreal Marketing also provides SEO training for marketing departments that want to bring more search knowledge in-house.